Hypothesis Testing
- jjinghui21
- Feb 4, 2023
- 1 min read
Updated: Feb 4, 2023
In this blog, I will be documenting about Hypothesis Testing. It is an ideal way to determine if a statistical hypothesis is true is by examining a sample of a population. Below, I am gonna show you how I apply hypothesis testing on our practical data from our DOE practical which was documented in my previous blog.


DOE PRACTICAL TEAM MEMBERS:
1. Person A (Iron Man) - Enzo
2. Person B (Thor) - Jing Hui [ME!!!]
3. Person C (Captain America) - Gayathri
4. Person D (Black Widow)- Ryan
5. Person E (Hulk) - Redza
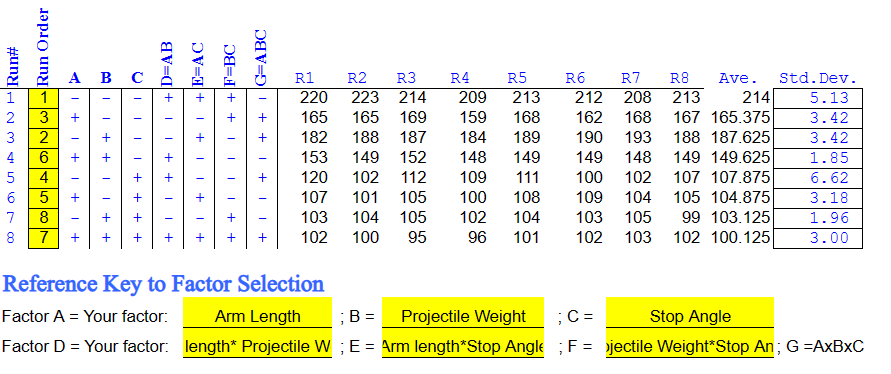
Our practical data:

The QUESTION | To determine the effect of projectile weight on the flying distance of the projectile |
Scope of the test | The human factor is assumed to be negligible. Therefore different user will not have any effect on the flying distance of projectile. Flying distance for catapult is collected using the factors below: Arm length = 27.9 cm Projectile weight = 0.86 grams and 2.02 grams Stop angle = 60 degree |
Step 1: State the statistical Hypotheses | Null hypothesis (H0): The flying distance will be the same for both projectile weights. [μ2 = μ4] Alternative hypothesis (H1): The flying distance will not be the same for both projectile weights. [μ2 ≠ μ4] |
Step 2: Formulate an analysis plan | Sample size is 16 as the experiment was repeated 8 times for each run. n1 = 8 n2 = 8 n = 16 Therefore t-test will be used. Since the sign of H1 is ≠ , a two tailed test is used. Significance level (α) used in this test is 0.05 |
Step 3: Calculate the test statistic | |
Step 4: Make a decision based on result | SL = 0.05 Two tailed = 0.05/2 = 0.025 CL = 0.975  From the distribution table, at v = 14, t0.975 = 2.145 Type of test (check one only) 1. Left-tailed test: [ __ ] Critical value tα = - ______ 2. Right-tailed test: [ __ ] Critical value tα = ______ 3. Two-tailed test: [ ✔ ] Critical value tα/2 = ± 2.145 Use the t-distribution table to determine the critical value of tα or tα/2  Compare the values of test statistics, t, and critical value(s), tα or ± tα/2  The test statistic falls within the rejection region; therefore, the null hypothesis (H0) is rejected at the 0.05 level of significance.
|
Conclusion that answer the initial question | |
Comparing my conclusion with the conclusion from the other team members | Person A (Iron Man) - Enzo Person E (Hulk) - Redza
|
inferences from these comparisons | A change in projectile weight will affect the flying distance. The larger the projectile weight, the shorter its flying distance. |
learning reflection on this Hypothesis testing activity | I learnt that the typical default significance level (α) to be used is 0.05. When we conduct hypothesis testing in the next semester, we should not alter this number to be anything larger than 0.05 as this would skew our results. We should be honest and not manipulate values so that it favours us. I feel that this tool was difficult to understand initially as different formulas are to be used depending on the situation. However, with more practice, this tool can help us determine if a statistical hypothesis is true or false. |


Comments